Hel AQI Desktop Widget
Hel AQI is a personal desktop monitoring tool I built for Windows to track outdoor air quality in Yerevan in real time during the winter pollution season. The widget reads data from nearby public Sensor.Community sensors, converts particulate measurements into AQI values, and displays the current status directly on the desktop.
The interface was implemented in Rainmeter using custom .ini configurations, Shape meters, and dynamically generated resource files. A Python script handles data collection, AQI calculation, trend detection, history storage, and graph rendering, while the widget layer presents the data in a lightweight always-visible desktop UI.
Outcome: a fully working personal monitoring widget with live AQI values, trend indicators, category-based color coding, and per-location 24-hour graph views.
Architecture
Hel_AQI/
├── Hel_AQI.ini
├── Hel_AQI_HomeGraph.ini
├── Hel_AQI_VanyaGraph.ini
├── script/
│   ├── aq_widget.py
│   ├── update_aqi.bat
│   ├── run_aq_daemon.vbs
│   ├── aq_widget_log.txt
│   └── Hel_AQI.ini
└── @Resources/
    ├── aqi_data.inc
    ├── aqi_last.json
    ├── aqi_history.json
    ├── aqi_graph_home.png
    ├── aqi_graph_vanya.png
    └── icons/
        ├── arrow_down.png
        ├── arrow_flat.png
        └── arrow_up.png
Rainmeter skin structure with Python-driven data generation, persisted AQI state, historical graph assets, and custom icon resources.
Overview
This project was built as a practical desktop utility for monitoring air pollution in Yerevan, where winter air quality can become severely degraded during the heating season. I wanted a lightweight always-visible widget that would show current conditions without opening a browser, mobile app, or weather dashboard.
The system pulls PM2.5 and PM10 data from nearby public Sensor.Community sensors, converts these readings into AQI values using breakpoint-based logic, and maps the results to pollution categories and interface colors. It also compares new measurements with previous values to show trend direction through custom arrow icons.
The result is a compact Windows desktop widget that provides real-time awareness, historical daily charts, and quick visual interpretation of air quality conditions for multiple tracked locations.
What I Built
Core Features
- Desktop AQI widget for Windows built with Rainmeter and Python
- Real-time polling of nearby public air quality sensors through the Sensor.Community API
- AQI calculation from PM2.5 and PM10 concentrations using breakpoint-based conversion tables
- Support for multiple tracked locations with separate labels, states, and graph views
- Color-coded status display based on AQI severity categories
- Trend arrows indicating whether the latest AQI reading is rising, falling, or unchanged
- Persistent JSON state storage for previous values and rolling 24-hour history
- Automatic generation of transparent PNG charts with matplotlib for daily AQI history
- Interactive circle click actions that open per-location graph panels inside Rainmeter
- Custom-drawn icon assets and configurable widget behavior through Rainmeter settings
Responsibilities
- Designed the full widget concept, desktop layout, and data presentation model
- Implemented the Python data pipeline for sensor polling, AQI computation, trend comparison, and state persistence
- Built the Rainmeter UI using Shape meters, string meters, image meters, and modular .ini configuration files
- Created graph generation logic and exported chart images for Rainmeter display
- Organized the resource layer for generated variables, graphs, icons, and JSON state files
- Drew custom trend icons for the desktop interface
- Configured multi-panel navigation between the main widget and detailed graph windows
- Tested the widget in live use and refined the display for readability, color hierarchy, and quick visual scanning
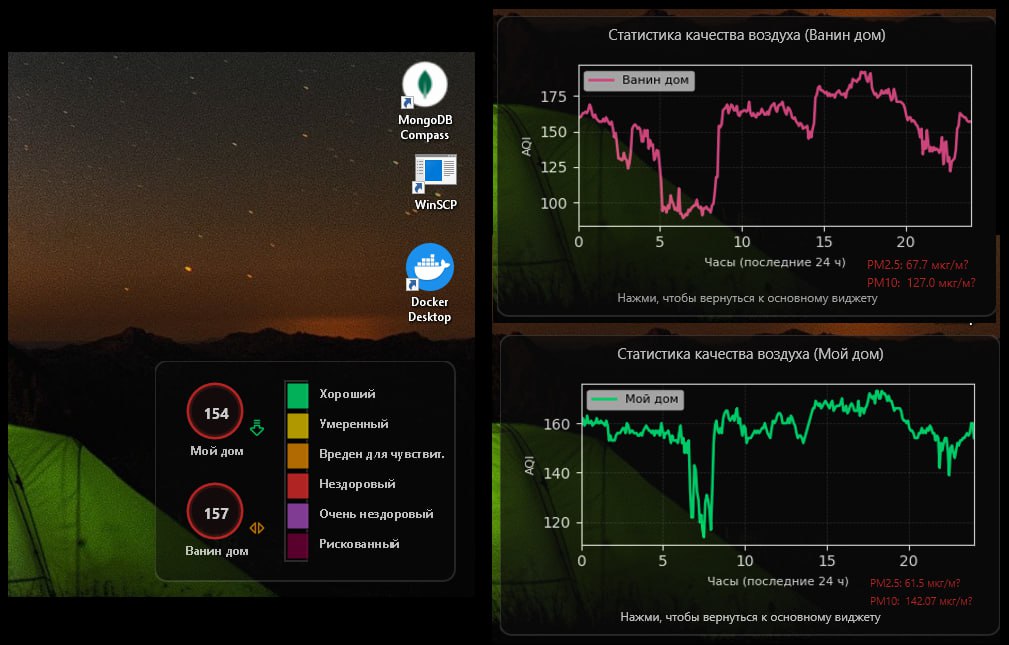
Main desktop widget showing AQI values for two tracked locations, severity colors, trend arrows, and a compact category scale.
Technical Details
The core logic was implemented in Python as a small local data-processing pipeline. The script requests particulate readings from Sensor.Community, extracts PM2.5 and PM10 values, converts them into AQI scores, and writes the processed values into Rainmeter-readable variable files.
To support trend detection and historical visualization, the widget stores both the latest state and a rolling AQI history in JSON files. Each update compares the newly calculated AQI against the previous reading, assigns an up / down / flat trend icon, and appends the current sample to a 24-hour history window.
For graph rendering, I used matplotlib in headless mode to generate transparent PNG charts that Rainmeter can display as image meters. This made it possible to keep the Rainmeter layer lightweight while still showing readable historical graphs with proper labeling and per-location coloring.
On the UI side, the desktop skin was built entirely through Rainmeter configuration files, using Shape meters for circles, scales, and panels, image meters for trend icons and graph assets, and string meters for labels and AQI values. The final result behaves like a compact desktop dashboard while remaining fully configurable through Rainmeter’s native options.
The widget refreshes automatically, supports separate graph panels for each tracked location, and is designed for daily personal use rather than as a one-off visual mockup.
Architecture / Workflow
- Step 1: The Python updater requests sensor data for the configured locations from the Sensor.Community API.
- Step 2: PM2.5 and PM10 readings are extracted from the returned sensor payloads.
- Step 3: The script converts particulate values into AQI scores and maps them to severity categories and interface colors.
- Step 4: The new values are compared with the previous state to determine trend direction and update rolling history.
- Step 5: The script writes Rainmeter variable files and renders updated PNG graphs for each tracked location.
- Step 6: Rainmeter displays the refreshed widget on the desktop and opens detailed graph panels on click.
Challenges & Solutions
-
Challenge: Rainmeter is strong at rendering lightweight desktop UI but is not designed for complex API handling or time-series processing.
Solution: I split the system into two layers: Python for external data collection, AQI calculation, history management, and chart rendering; Rainmeter for presentation only.
Result: The widget remained visually lightweight while still supporting dynamic live data and daily graphs. -
Challenge: Public air quality data sources can be inconsistent, incomplete, or tied to multiple nearby sensors.
Solution: I implemented logic to work with configured sensor IDs when available and otherwise select the nearest suitable sensor from the response set.
Result: The widget could reliably resolve usable air quality data for the tracked locations. -
Challenge: Historical AQI visualization needed to work inside a desktop widget environment that does not natively generate charts.
Solution: I used headless matplotlib rendering to export transparent PNG graphs and then displayed them inside dedicated Rainmeter graph skins.
Result: The system provided both real-time monitoring and readable 24-hour trend views. -
Challenge: Air quality values are difficult to interpret quickly if shown only as raw PM numbers.
Solution: I added AQI conversion, category-based color coding, trend arrows, and a compact severity scale directly into the widget interface.
Result: The dashboard became readable at a glance without requiring the user to interpret raw sensor values manually.
Result
The final result is a working Windows desktop AQI dashboard that I use in everyday life to monitor outdoor pollution conditions in real time. It combines live sensor polling, AQI scoring, trend tracking, history persistence, and graph rendering in a compact desktop-friendly interface.
Beyond the visual side, this project demonstrates my ability to combine Python automation with a non-web UI layer, structure a small but complete data pipeline, and turn raw external measurements into an immediately understandable user-facing tool.
It also reflects the kind of engineering I enjoy most: practical software built for real daily use, with both technical depth and thoughtful interface design.